The fundraising thermometer is a standard nonprofit tool for websites, posters, presentations, and reports. Creating them and updating them can be awkward, especially if you need a high-resolution image.
I build this thermometer in a spreadsheet, where all the user has to do is enter a title and a few numbers and the image generation is completely automatic. It can then be pasted into whatever program you like.
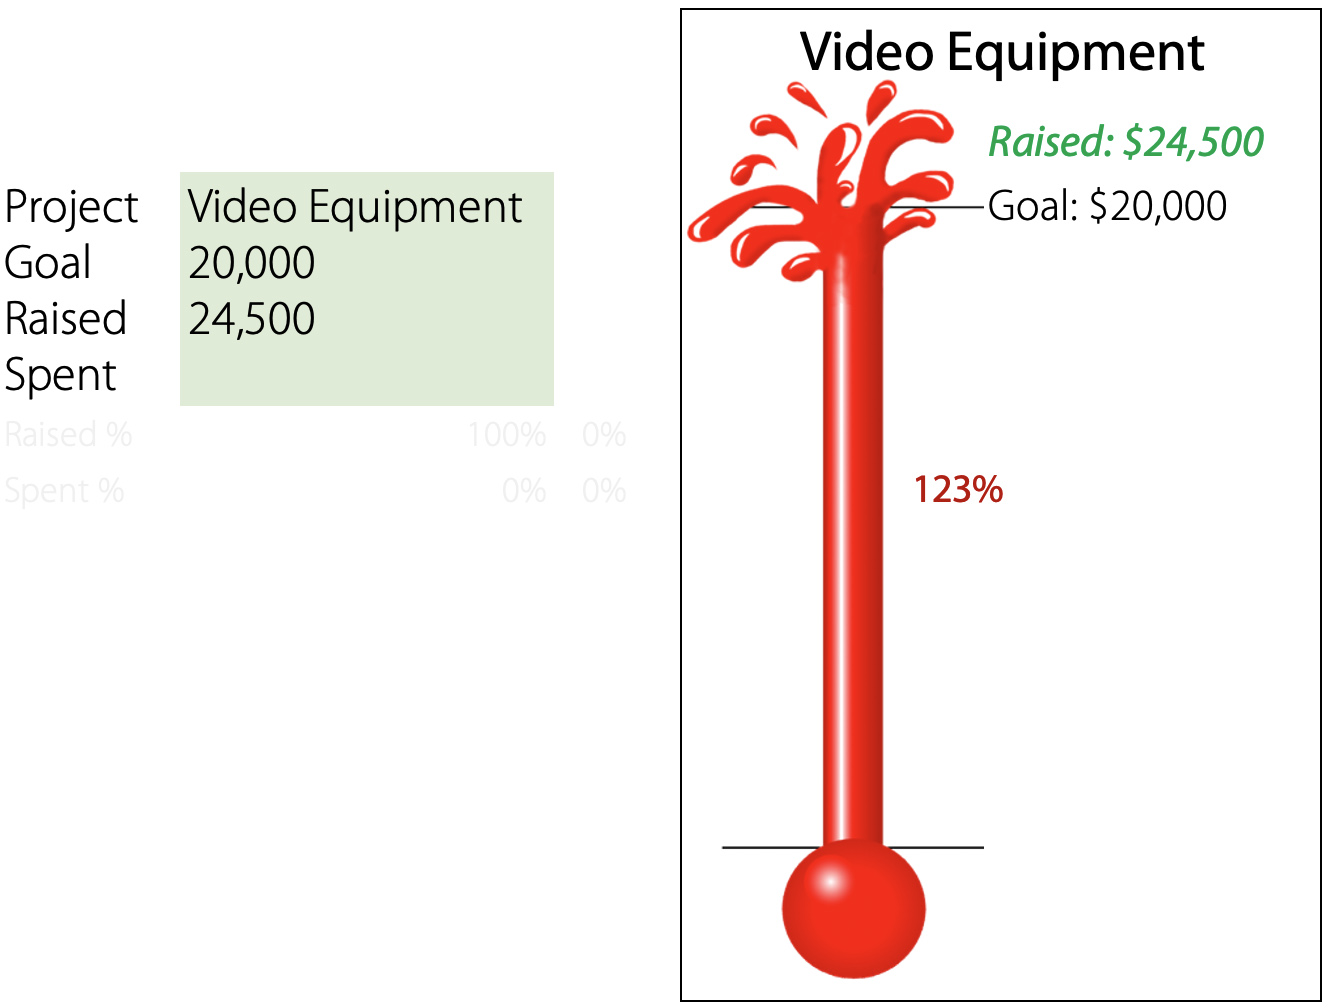
To build this spreadsheet, I started by creating the graphics for the thermometer bulb, the full part of the thermometer, the empty part, the top of the thermometer, and the “explosion.
I used a column chart overlaid on the graphics to change the amount raised, and put the text in cells behind the chart. The box and horizontal lines are cell borders.


Tools used for this project
- Adobe Photoshop to create the thermometer graphics
- Microsoft Excel for everything else